An Astonishing Graph
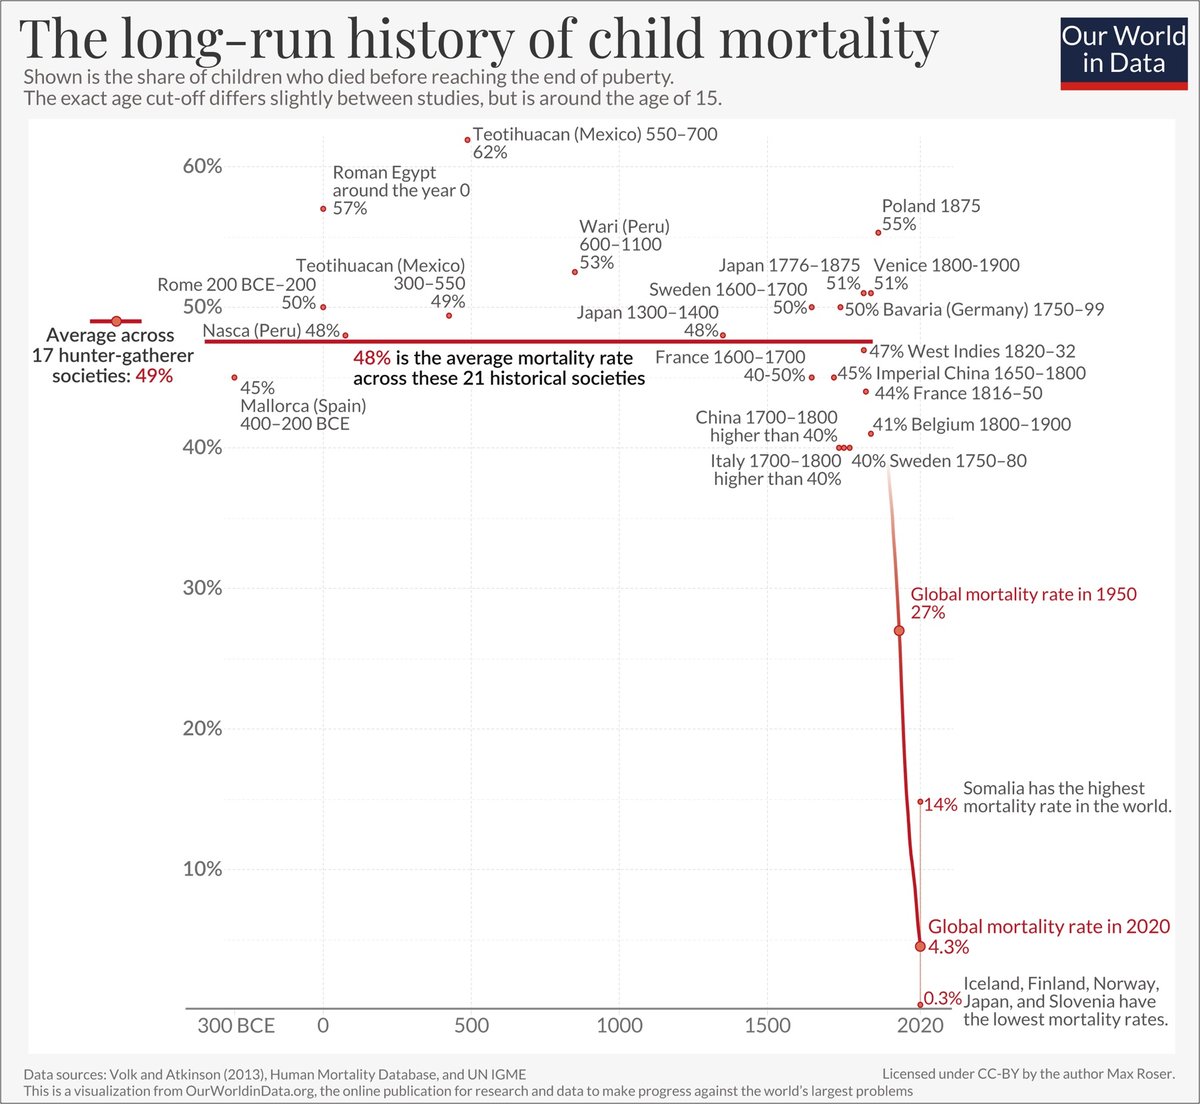
For most of human history, around 50% of children used to die before they reached the end of puberty. In 2020, that number is 4.3%. It’s 0.3% in countries like Japan & Norway.
This dramatic decline has resulted from better nutrition, clean water, sanitation, neonatal healthcare, vaccinations, medicines, and reductions in poverty, conflicts, and famine.
Before ~1800, almost every parent lost a child; now it’s such an uncommon experience that people have forgotten and want to ban vaccines.
Comments 0
No comments yet. Be the first to comment!